How much electricity do solar panels generate? Design decides
What a rooftop solar system really generates in a year, where the energy gets lost, and why two identical systems on the same street can differ by 15% or more.
Every kilowatt of solar panels on a roof produces somewhere between 900 and 1,800 kWh a year, depending on where you live. A 6 kW home system in Sydney or Los Angeles typically lands around 8,000–9,500 kWh. The same system in London or Seattle makes closer to 5,500–6,500.
Location sets the ceiling. But how close you get to that ceiling has very little to do with the panel brand. It comes down to where the panels sit, which way they face, what shades them and how hot they run. In other words: the design.
The quick way to estimate generation
Installers everywhere use the same simple formula:
Yearly kWh = system size (kW) × specific yield (kWh per kW per year)
Specific yield is what 1 kW of panels produces in your location after normal losses. Some rough figures:
| Location | Typical specific yield |
|---|---|
| Arizona, Nevada, Middle East | 1,600–1,850 kWh/kW |
| Southern California, Spain, Western Australia | 1,450–1,700 kWh/kW |
| Queensland, New South Wales, India | 1,350–1,600 kWh/kW |
| Texas, Florida, Victoria (AU), South Africa | 1,250–1,500 kWh/kW |
| US Northeast and Midwest, New Zealand | 1,100–1,350 kWh/kW |
| Germany, UK, Netherlands, Canada (east) | 850–1,100 kWh/kW |
These numbers assume a sensible layout: panels facing roughly toward the equator (south in the northern hemisphere, north in the southern), at a reasonable tilt, and not shaded. Every way your roof falls short of that comes off the top.
Where the energy actually goes
Sunlight hitting the panel isn't the same as energy on your meter. Here's a typical loss list for a rooftop system in a warm climate:
- Heat: 6–12%. Panels lose about 0.3–0.4% of their output for every degree above 25 °C (77 °F). On a summer afternoon in Phoenix or Perth, panels run at 60–70 °C. Panels mounted tight to the roof with little airflow run hotter than raised ones.
- Dirt: 2–7%. Dust, pollen and bird droppings. Low-tilt panels hold dirt longer because rain doesn't wash it off as well.
- Inverter: 2–4%. Converting DC to AC is never free.
- Wiring and mismatch: 2–3%. Long cable runs and panels that aren't perfectly matched.
- Shade: anything from 0% to 30%. This one depends entirely on the layout.
You can't do much about the first four. Shade, direction and tilt are the ones a good design controls.
Why design matters more than the panel brand
The gap between a premium panel and a standard tier-1 panel is maybe 2–3% in efficiency. A poorly planned layout can easily cost five times that. These are the mistakes we see most often:
Panels too close to a chimney, vent or AC unit. Even a small chimney throws a long shadow when the sun is low in winter. If a couple of panels sit in it, they can drag down the whole string they're wired into, not just themselves. Microinverters and optimizers soften this, but they don't make shaded panels produce.
Ignoring trees and neighbouring buildings. A tree two houses away can shade one corner of your roof for an hour every afternoon. It doesn't look like much, but over a year it adds up, and trees grow.
Filling a poor roof face just because it's there. A west-facing face makes roughly 10–20% less than an equator-facing one, and a face pointing away from the equator can lose 30% or more. Sometimes fewer panels in the right place produce almost the same energy for a lot less money.
Rows packed too tightly on a flat roof. Tilting panels up helps, but each row shades the one behind it when the sun is low. Without enough spacing, you lose the mornings and afternoons of the darkest months, exactly when you have the least to spare.
Same roof, two designs
Here's an illustrative example: a two-face pitched roof with a chimney, a plumbing vent and a large tree on the neighbour's side. One face points toward the equator, the other faces west. Both designs use a 6 kW system with the same panels and the same inverter, in a location with a specific yield of around 1,500 kWh/kW.
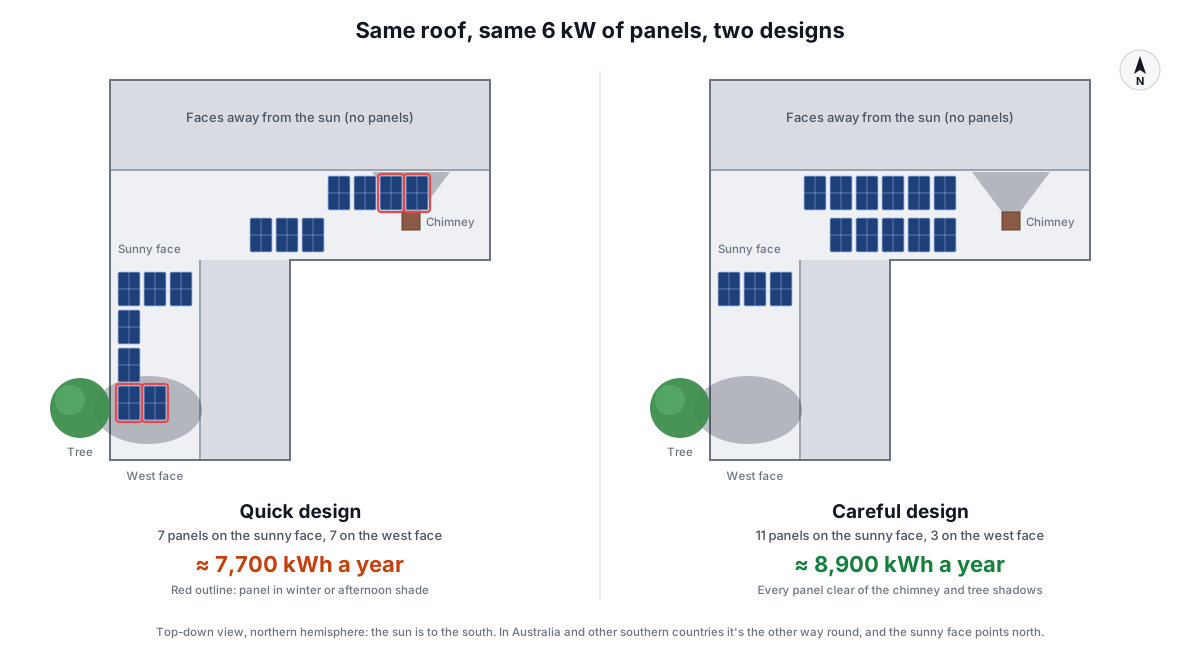
On the left, the panels were spread evenly to fill space. Four of them (outlined in red) spend part of the day in shade: two behind the chimney when the winter sun is low, and two under the tree in the afternoon. On the right, the same 14 panels are moved where the sun actually reaches them.
| Quick design | Careful design | |
|---|---|---|
| Panel placement | split evenly across both faces | most panels on the equator-facing face |
| Near the chimney | 2 panels in its winter shadow | clear of the shadow zone |
| Tree side | panels up to the edge | shaded corner left empty |
| Panels on the west face | 7 | 3, in its unshaded part |
| Yearly generation | about 7,700 kWh | about 8,900 kWh |
That's around 1,200 extra kWh every year from the same hardware. At 20 cents a kWh, that's about $240 a year, or roughly $6,000 over a 25-year system life. The careful design didn't cost a cent more to install. It just took more thought before the first panel went up.
Rule of thumb: if a design can't show you where the shadows fall on the shortest day of the year, it hasn't really checked for shade.
How to check a design before you sign
You don't need to be an engineer to ask good questions. When an installer shows you a layout:
- Ask where the shadows fall in winter. Morning, noon and afternoon. If the answer is a shrug, be careful.
- Ask for monthly generation, not just a yearly total. A real estimate follows the seasons. If all twelve months look the same, it's a guess.
- Check the direction of every panel group. Mixed directions are fine, but each should come with its own number.
- Compare kWh per kW against the table above. A quote that claims 1,700 kWh/kW in New Jersey is too good to be true. One that shows 1,100 in Arizona means something in the layout is wrong.
We go through the rest of a quote in our guide on how to read a solar proposal.
Try it on your own roof
You can see all of this for your own house in Solarqivo. Find your building on the satellite map, trace the roof, and the designer places panels around chimneys, vents and anything else on the roof. The 3D view shows the shadows for any day and hour, and the estimate is built month by month from long-term NASA weather data for your exact location, anywhere in the world. Move a row, change the tilt, and the yearly kWh update straight away. It's the fastest way to see what a better layout is worth.
Not sure how many panels your roof can take in the first place? Start with how many solar panels fit on my roof, then read about the best tilt and direction for your location.